![]()
This very useful command draws a graph representing the distribution of the pixels values behind your image.
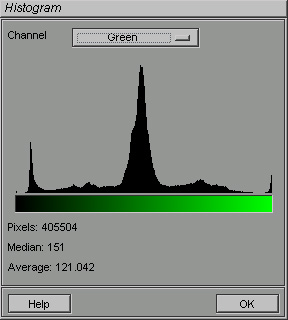
You have the possibility to change the color channel by opening the Channel drawer.
The histogram menu also displays statistical data like :
Pixels ... the total number of pixels composing the image
Median value (depending on the channel you choose in the picture right up the histogram displays the green median value. This is the value that separates the pixels in 2 groups containing each one exactly 50 % of the distribution.
Average displays you the average value of the selected channel.